
ZBIN Data Binning Software
If your experimental data is not already binned, ZBIN—our advanced binning software—can do this for you as a preliminary step. This is not simple binning. Rather, it uses weighted regressions based on Gaussian distributions to properly bin your data, while giving you full control over the binning parameters.
Traditional Binning
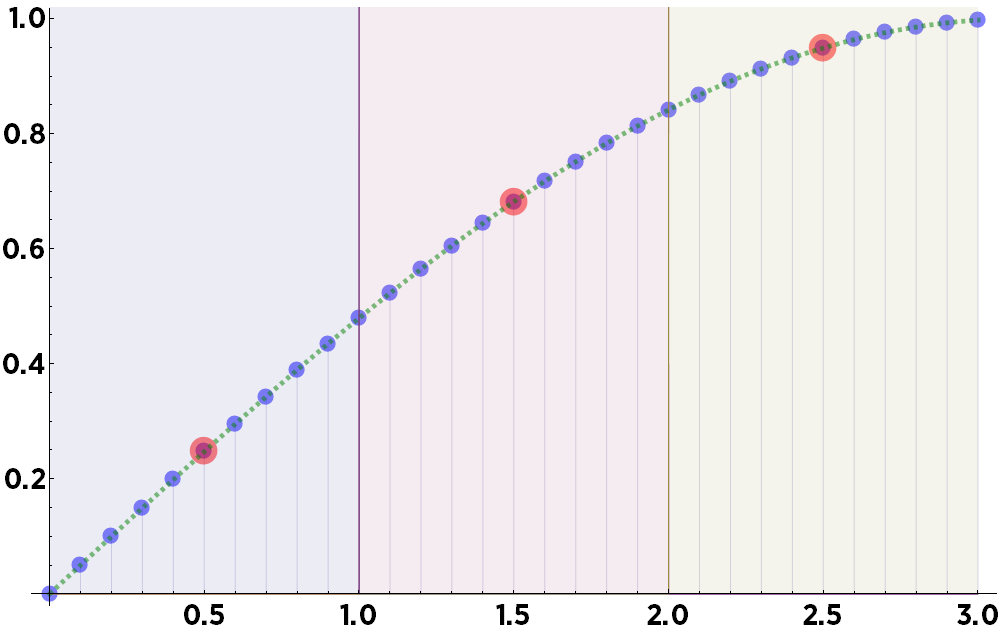
Consider the following data points (blue dots). They perfectly represent the function sin(x/2), shown here as a dashed green line, from 0 to 3.
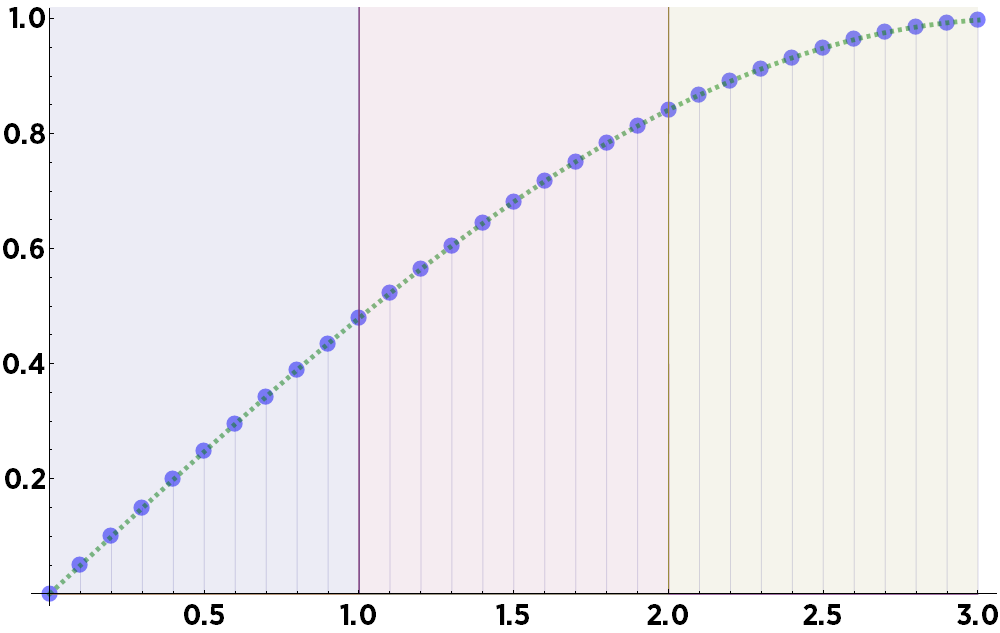
These represent the best data points you might expect to collect under ideal experimental conditions: data points with absolutely no noise.
Suppose you want to place this data into three bins, from 0 to 1, 1 to 2, and 2 to 3—represented here by the background colors blue, red, and tan. The standard binning method is to simply take the mean within each bin. The means are indicated here by red circles:
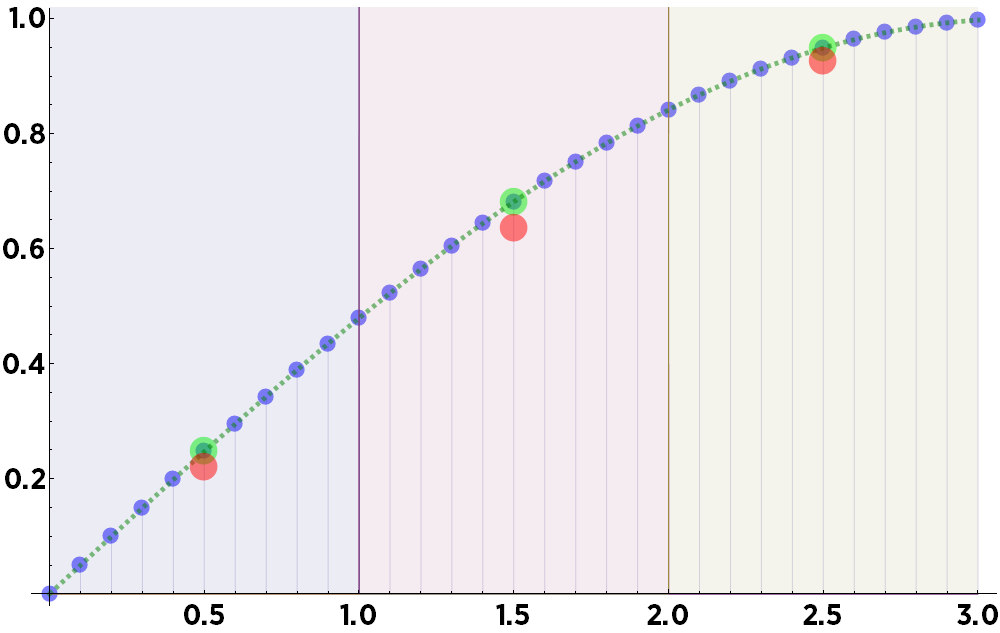
Obviously, on this data, the mean consistently underestimates the actual value at the center of each bin, represented here as green circles. (On some other types of data, such as exponentially increasing curves, taking the means would consistently overestimate the values.)
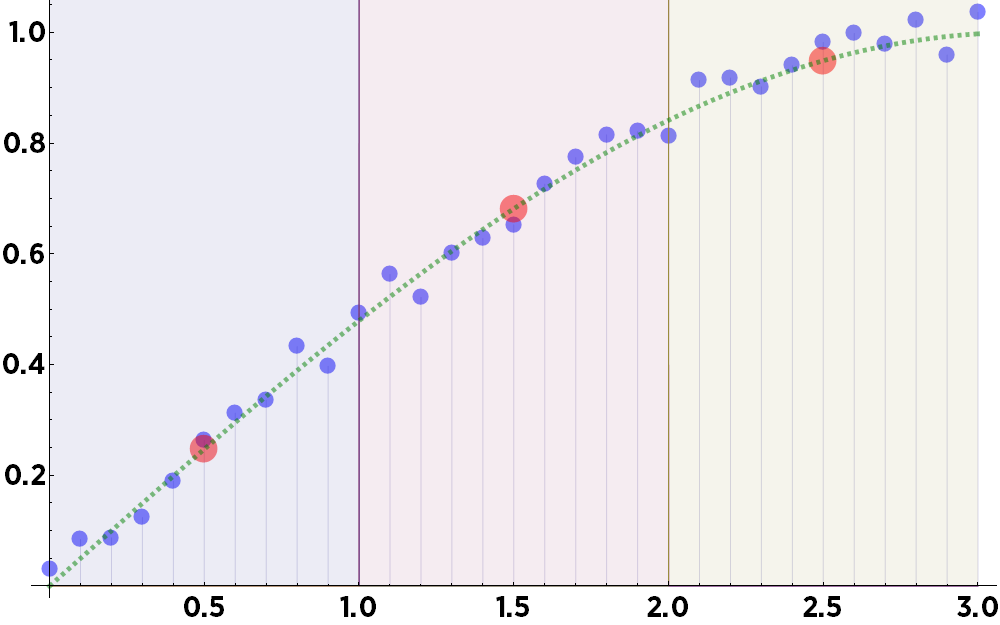
When you add noise to the data, things certainly don't improve:
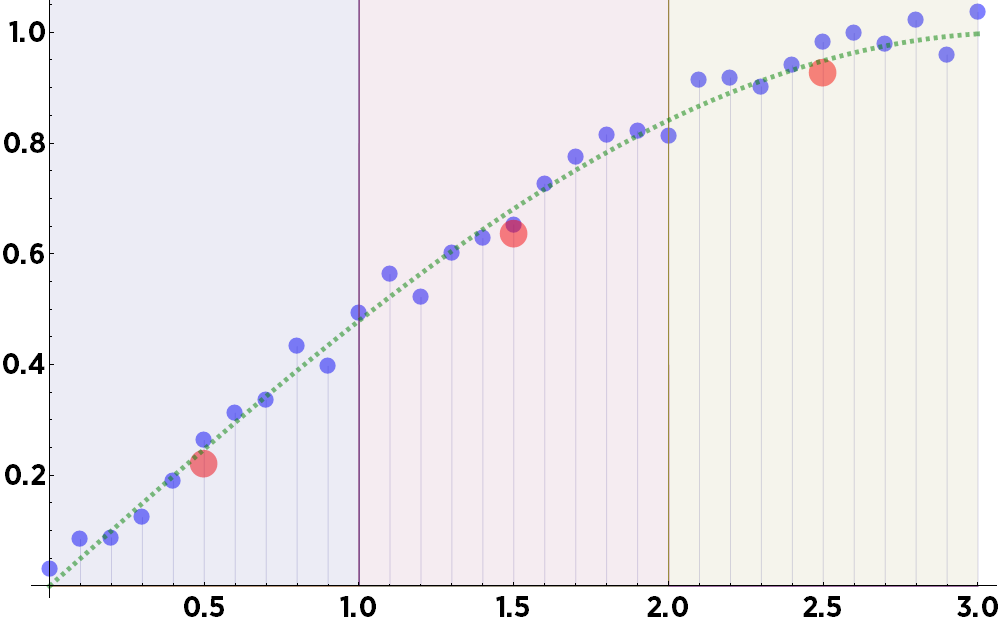
This is not good, either way. Traditional binning introduces an offset to your data—even if your data is perfectly noise-free!
The ZBIN Solution
The problem with the traditional method is that all data points within a bin are weighted evenly. However, the data points near the edges of the bin (for example) do not represent the desired value as well as data points near the center of the bins. Further, data points that lie near the edges of a bin can arbitrarily affect one bin or the other, which means that changing the binning parameters slightly can dramatically alter your results.
ZBIN provides a far superior alternative. A Gaussian distribution is created, centered within each bin. The width of the Gaussian is a user-configurable option. (Configuring the width of the determines the amount of smoothing applied to your data.) ZBIN then weights each point based on the amplitude of the Gaussian at that point. Therefore, every point contributes to every bin—even points that fall outside of the bin: they just contribute less. It might be one part in a hundred million, but it won't (technically) be zero.
Including points outside the bins, but with lesser weights, is particularly important when there is any amount noise in the data, however small. It ensures that the noise is evenly distributed across all bins, rather than being distributed unevenly in adjacent bins.
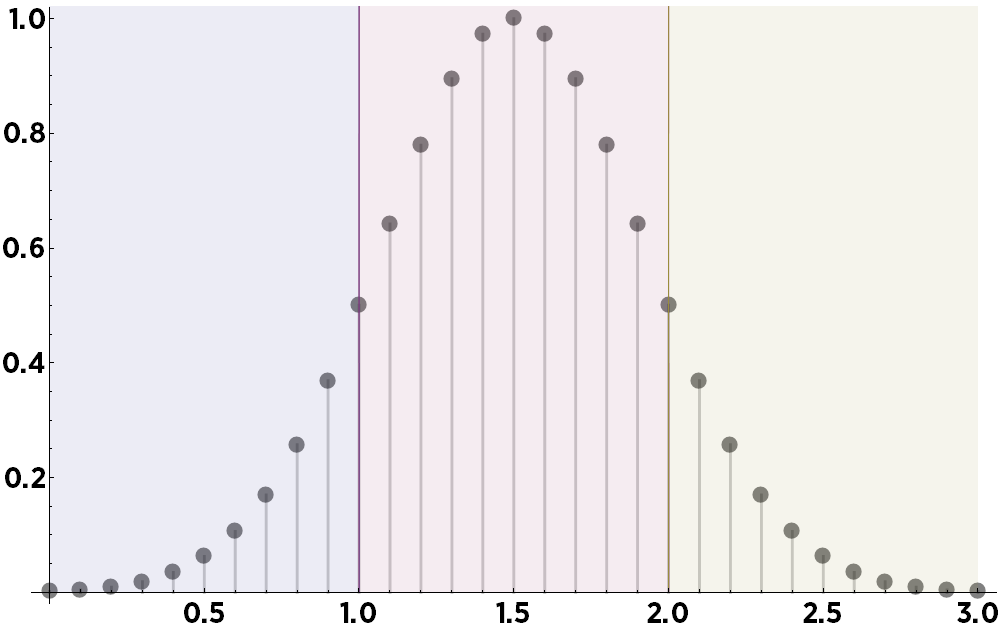
To visualize the result of this computation, here are the relative weights assigned to all of the points for the first bin in our example:
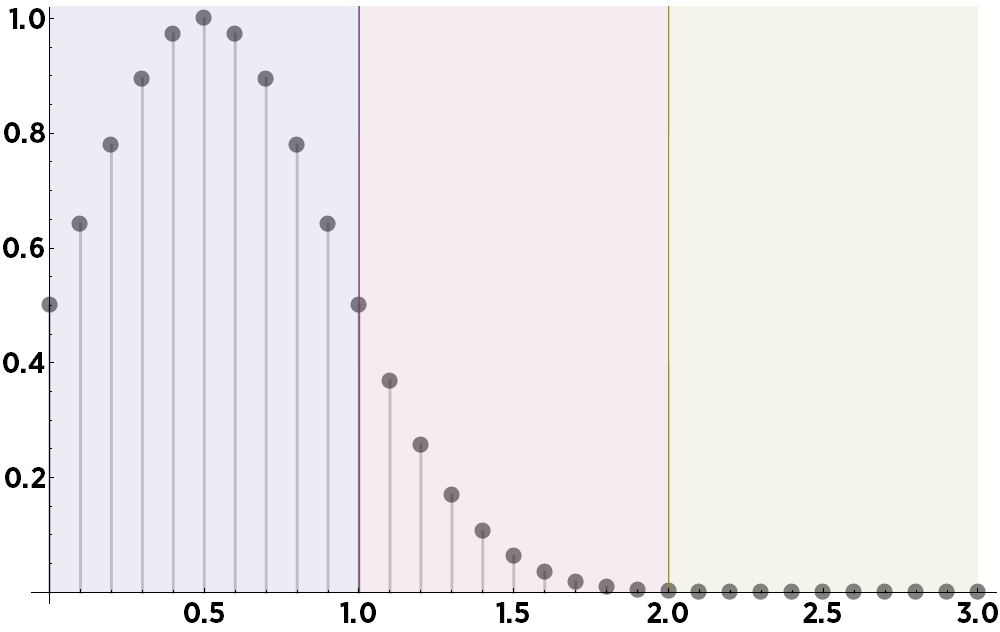
And the second:
A weighted regression is then performed on the data using those weights. Both underfitting and overfitting are avoided by performing a bias-variance decomposition and randomly and repeatedly distributing the data points into training and test sets, until a final optimal value is obtained for each bin. The result is significantly improved over the classic method, and in our example the binned values fall precisely on the curve:
This method works equally well with noisy data, finding the true values along a curve which is hidden in the noise:
This method does not require any a priori knowledge of your data. So long as there are sufficient experimental data points, it works regardless of the type of data, the shape of the underlying curve, or the type or amount of noise.